How do we measure the ionosphere?
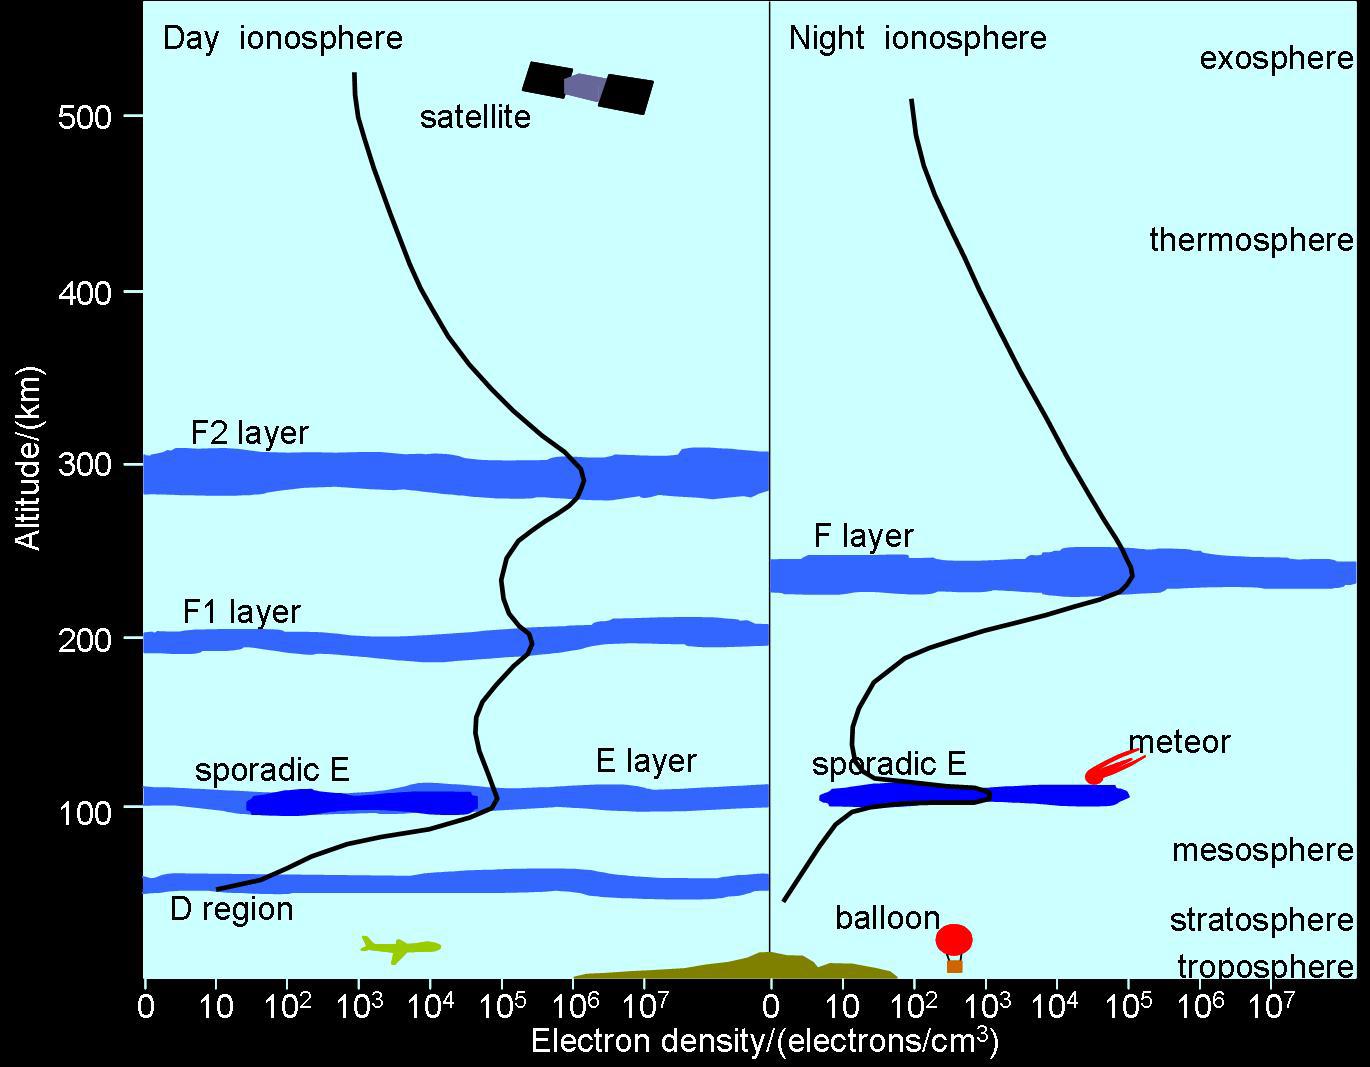
Our measuring network focuses on the Earth's ionosphere. It's an upper atmospheric layer which is located approximately in the heights from 60 km to 1000 km. Thanks to the solar activity, the neutral gas is ionized in the ionosphere so the low temperature plasma is created there. Except the Sun, the ionospheric plasma can be influenced by the Jupiter magnetic storms, meteors or some strong gamma ray bursts. In accordance with the height where the plasma is located in, we can devide the ionosphere into three basic regions, D, E and F. Their location depends significantly on the day time and on the season. For example, the D region is nearly completely recombined at night. As a typical summer phenomenon, then, the F region is possibly split into the F1 and F2 regions and so-called sporadic layer can be formed in the E region.
The ionospheric regions are shown in Figure 1. The diagram compares their height with the notoriously-known atmospheric layers.

We can see that the ionospheric regions are also compared using the electron density. This quantity is one of the most important physical diagnostics of any plasma. It shows the amount of charge particles found in unit volume. The electron density is specific for the current time and height and is also strongly influenced by a high-energy impacts reaching the atmosphere.
This phenomenon, which we measure, is called ionospheric response. But how can the ionosphere be measured, indeed?
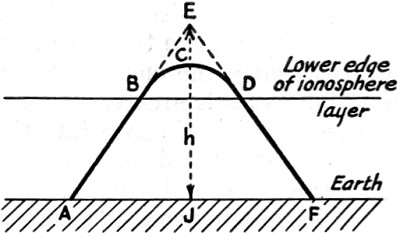
Owing to the presence of some charge particles, the layer can reflect radio signals transmitted on a characteric frequency. This frequency is also dependent on the height where we want to measure. The principe of our measurement is not difficult. Imagine having an overground radio transmitter and a receiver located somewhere behind the horizon. It's easy to deduce that the emitted signal must be reflected by the ionosphere before it reaches the receiver. Using such a machines, we are able to measure the radio signal intensity level. Within the appropriate model, we can compute a lot of variables describing the ionospheric plasma. An illustrational scheme is given in Figure 2.
Figure 2

The frequency of measured radio signal differs in dependence on the appropriate ionospheric region. The D ionospheric region is monitored by the VLF (Very Low Frequency) measurement within the SID monitors, see VLF Data Analysis. Good results were achieved on the frequency of 23.4 kHz where the DHO 38 transmitter can be tuned in.
Figure 3

The E and F regions, however, have too big electron density to be monitored by the VLF and the scale of High Frequency needs to be used. Such a measurement is conducted by the digisonde. In the Czech Republic, the Institute of Atmospheric Physics of the Czech Academy of Science carries out one digisonde in Průhonice. See this webpage.
One of the most important diagnostics of the ionosphere is called ionogram. It is a graph where the electron density and height are compared. The electron plasma frequency, which is almost the same as electron density, can be used, too. Some sample ionograms are given.
Figure 4

Figure 5

Some knowledge about the strong impacts, such as solar eruptions, magnetic storms and the GRBs can also be worked out within the HF measurement by a small radiotelescopes, see HF Data Analysis.
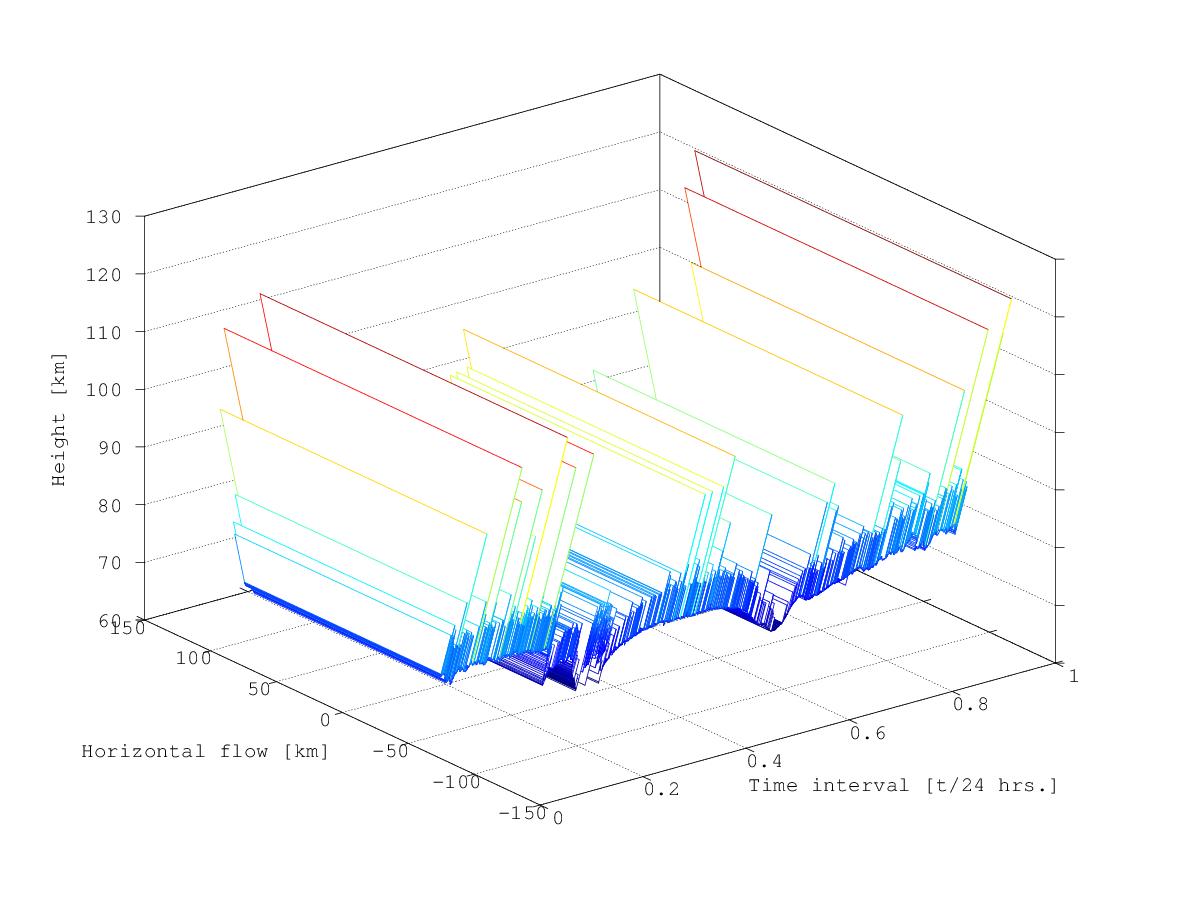
However, no ionospheric region is a homogenous layer. The plasma drifts strongly in horizontal and vertical direction as well. For example, the focusion and defocusion of charge particles can be discussed, see Figure 6.
Figure 6

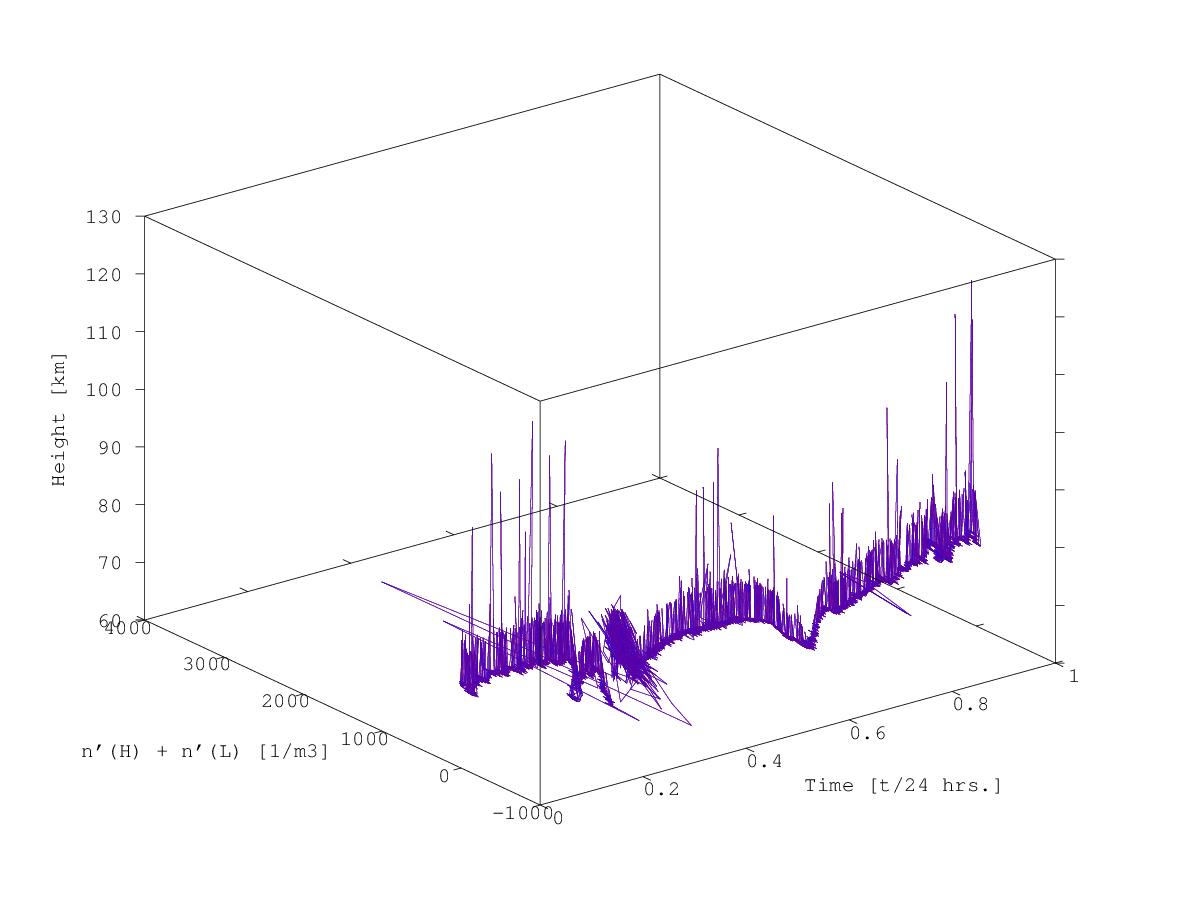
To get the exact data of this plasma flow, the Doppler measurement has been designed. The method is based on the Doppler Effect, which can be described as a frequency change induced by some locomotion. It is known that if the measured plasma approaches us, the frequency escalates and if it recedes, the frequency is tapered off. Because of these phenomena, the blue and red shift can be recognized and measured. It provides us to have the exact specification of the ionospheric drift.
Figure 7
