VLF Data Analysis
What do we measure by the SID monitors?
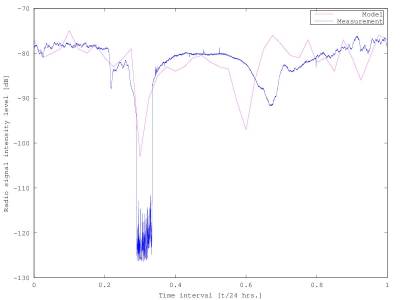
The SID monitors are inductive coils that receive radio signal from a transmitter with the characteristic frequency given. While the signal spreads through the ionospheric plasma, its intesity changes in dependence on the current electron density. We model the electron plasma frequency using the measurement of the radio signal intensity level, which helps us to determine other quantites and phenomena. The transmitter’s characteristic frequency must be known, too. For our computations, the radio signal from the DHO 38 transmitter located in north - western Germany is used. Its frequency equals 23.4 kHz. We deduce that this frequency converges to the critical frequency of the D ionospheric layer.
The plot describing how the measured data look like is shown.
Figure 1
Basicly, we use polynomial differential equations to describe the electron plasma frequency. We know the middle value which also equals 23.4 kHz. It means that the photon spreading through the plasma is refracted by the electrons with the same oscillation frequency. However, the electron plasma frequency changes and it’s numerical solution is the result of our basic equation, indeed. The grap his given if Figure 2.
Figure 2
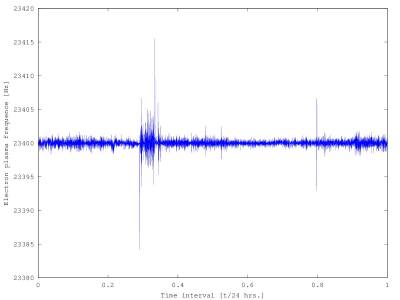
We can deduce that the electrons oscillate among heavy ions with variable amplitude and frequency, which is important to determine the current electron density, too.
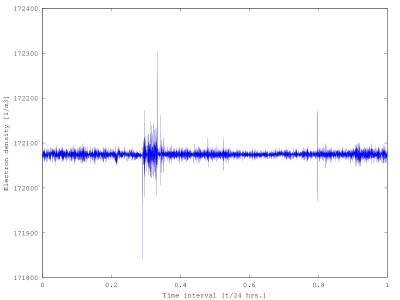
If the electron plasma frequency is known, we can compute the ionospheric electron density. Actually, it’s known that the electron’s oscillation frequency is the total function of the amount of electrons and heavy ions. Applying the appropriate equation we get the momental electron density shown in Figure 3.
Figure 3
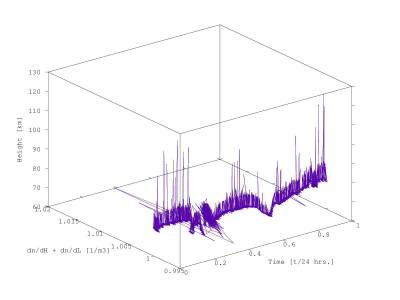
Within the system of differential equaitons with electron density included, we can also approach the height where an impact reached the ionosphere. These plots where electron density is compared with height are called ionograms. The ionogram from March 6, 2016 is given. Height is approximated as the function of electron density’s derivation and the whole phenomenon is compared in time, too. Some stronger impacts can be seen and recognized easily.
Figure 4
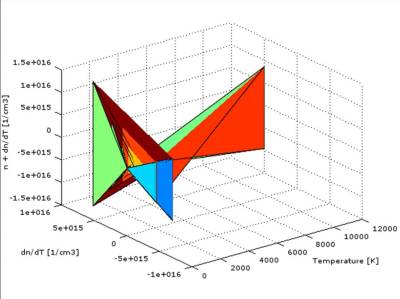
We are able to work out how the impacts affected ionization and recombination in the low - temperature ionospheric plasma. By the time these parameters are known, we can use a system of other differential equations to compute the electron density and temperature of the fireball and plasma located to surround the solid. We can even form the contour plot of the temperature-dependent electron density’s distribution and approach the chemical emission spectra of the investigated fireball. We deduced that the shiny fireball detected on March 6, 2016 might have been consisted of some pyroxenes. The electron density, temperature and their distribution models are given.
Figure 5
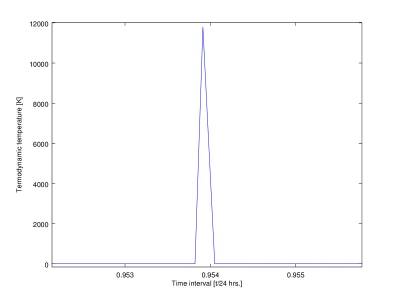
Figure 6
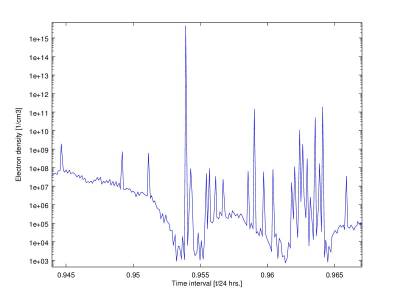
Figure 7
The data were prepared by Vojtěch Laitl, Jaroslav Maxa and Vojtěch Fárek, The František Krejčí Observatory Karlovy Vary. All rights reserved.